I love SQL Server execution plans. It is often easy to spot the cause of a performance problem just by looking at one closely. That task is considerably easier if the plan includes run-time information (a so-called ‘actual’ execution plan), but even a compiled plan can be very useful.
Nevertheless, there are still times when the execution plan does not tell the whole story, and we need to think more deeply about query execution to really understand a problem. This post looks at one such example, based on a question I answered.
The Execution Plan

This plan is reasonably large (20MB cached plan size) but not massively complex once you break it down. The question is why this query usually executes in less than a minute, but sometimes it runs for nearly twenty minutes — though the plan appears identical in each case.
High-Cost Operators
There are many different things to look for in execution plans. What you choose to look at first is as much a matter of personal preference as anything, but many people are drawn to high-cost operators, so I will start there.
In this plan, the cost of one operator dominates all others, shown as being responsible for 100% of the cost of the query. It is highlighted in red in Plan Explorer; I have expanded the relevant plan section (the top right) below:

There is no doubt that this seek is a busy little thing. It is executed 249,484 times, though it only produces a grand total of 167,813 rows over all iterations of the loop join — an average of just 0.7 rows per seek.
There are all sorts of interesting details in the plan about this seek – I could write a whole blog post about it – but two details that stand out are the “Force Seek: True” and “Partitioned: True” attributes. These tell us that the base table is partitioned, and the query writer had to use a FORCESEEK table hint to get this plan.
Without this hint, the optimizer would almost certainly choose a Hash Match or Merge Join rather than Nested Loops. This is understandable given the optimizer’s cost model, and the simplifying assumptions it makes (such as assuming every query starts with a cold buffer cache).
That’s fine, but we can see from the query plan that the inner-side table has 643 million rows. Left to its own devices, the optimizer would estimate that it would be faster to perform a sequential scan of 643 million rows (with large block size read-ahead) than it would be to perform a quarter-million randomly-distributed seeks driven by a Nested Loops Join.
I doubt the optimizer’s reasoning here is sound (at least on any reasonably modern hardware) but there we go. The query author probably knows that a good fraction of this table is likely to be in cache, so with all that in mind, I think we can reasonably assume at this stage that the FORCESEEK hint is genuinely needed here, and this part of the plan is at least reasonably optimal.
- Important note
- The seek certainly does not account for 100% of the runtime cost of this query. Remember operator cost percentages are always estimates – even in ‘actual’ plans. It can be useful to check the reasons for high-estimated-cost operators, but they should never be used as a primary tuning metric.
Execution Warnings

This query was executed on SQL Server 2012, so there is a handy warning triangle on the Sort operator indicating that one or more sort runs had to be spilled to physical tempdb disk.
The plan also shows this spilling is a result of an inaccurate cardinality estimate at the Filter operator (the estimates are not bad at all prior to this point). The Sort expects 9,217 rows totalling approximately 5MB, but actually encountered 61,846 rows in 35MB. As you may know, memory for sorts and hashes is allocated before execution starts, and generally cannot expand dynamically at run time.
The spilled Sort is undesirable, of course, but it is unlikely to be a major cause of the occasional poor performance given the small size of the spilled data. Even so, this might be a good place to split this query up.
The idea would be to write the results of the query (up to and including the Filter) to a temporary heap table using SELECT INTO, then create a clustered index with the same keys as the Sort operator.
The temporary table would not be large, and may well perform better overall than the spilled Sort, including the cost of creating the clustered index. Of course, creating this index will involve a Sort, but it will be one based on the known cardinality of the temporary heap table.
The part of the plan that could be replaced by a temporary table is shown below:

I am a big fan of simplifications like this. Smaller execution plans tend to optimize better for all sorts of reasons, and the source code usually becomes easier to maintain as well. I should mention there is another warning triangle in the 2012 execution plan (shown on the root icon), which relates to some implicit conversions that I will mention later.
I/O Information
The execution plan was captured with Plan Explorer, so we can also easily see I/O statistics for the two executions. The first is for a fast (sub-60-second) run:
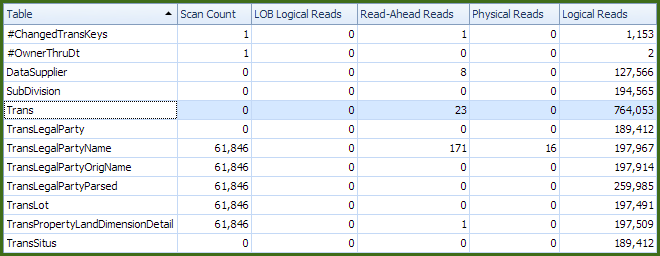
Overall, these I/O numbers show pretty much what we would expect: A decent number of logical reads associated with the seeks into the Trans table (but certainly not 100% of the total, ha ha), a very small number of physical reads, and a small amount of read-ahead activity on a couple of tables.
The second set of I/O data is from a slow run (18 minutes or so):
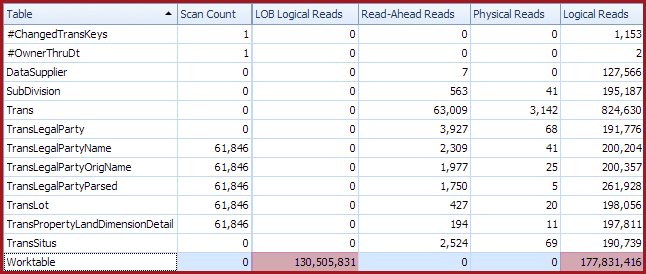
The very obvious difference is the appearance of a worktable, with 178 million logical reads and 130 million LOB logical reads. It seems very likely that this work table, and its 300 million logical reads, is responsible for the dramatic decrease in query performance.
But given that the execution plans are identical (right down to the XML) what is causing this? My answer to that question is that it relates to the increased level of read-ahead activity. To see why that is the case, we will need to reproduce the issue and dig a bit deeper.
Execution Outline
Before we really get going on this, it will be useful to take a look at what the execution plan is doing in outline. We saw the first part of the plan earlier when looking at the spilling Sort.
The data set at that point (which we would like to write to a temporary table, remember) essentially represents source data for a second query, which uses a series of Nested Loops Left Joins to lookup information from other tables:

The inner side of each join involves some reasonably involved logic, which is thankfully not important to the present discussion. What is important is that the result of each lookup is a LOB data type. This begins to shed some light on the LOB logical reads reported against the work table, but it does not explain why the work table (and the 300 million associated reads) do not appear when the query runs quickly (with the same execution plan).
Reproducing the problem
The source table used to drive the lookups will be a regular Numbers table containing just a single integer column. If you do not already have one of those, the following script will create one efficiently:
-- Itzik Ben-Gan's row generator
WITH
  L0   AS (SELECT 1 AS c UNION ALL SELECT 1),
  L1   AS (SELECT 1 AS c FROM L0 AS A CROSS JOIN L0 AS B),
  L2   AS (SELECT 1 AS c FROM L1 AS A CROSS JOIN L1 AS B),
  L3   AS (SELECT 1 AS c FROM L2 AS A CROSS JOIN L2 AS B),
  L4   AS (SELECT 1 AS c FROM L3 AS A CROSS JOIN L3 AS B),
  L5   AS (SELECT 1 AS c FROM L4 AS A CROSS JOIN L4 AS B),
  Nums AS (SELECT ROW_NUMBER() OVER (ORDER BY @@SPID) AS n FROM L5)
SELECT
    -- Destination column type integer NOT NULL
    ISNULL(CONVERT(integer, N.n), 0) AS n
INTO dbo.Numbers
FROM Nums AS N
WHERE N.n >= 1
AND N.n <= 10 * 1000 * 1000
OPTION (MAXDOP 1);
GO
ALTER TABLE dbo.Numbers
ADD CONSTRAINT PK_Numbers_n
PRIMARY KEY CLUSTERED (n)
WITH (SORT_IN_TEMPDB = ON, MAXDOP = 1, FILLFACTOR = 100);
The first part of the repro involves creating six tables that represent the lookup tables in the original query plan:
CREATE TABLE dbo.T1
    (id integer IDENTITY PRIMARY KEY, d char(2048) NOT NULL);
CREATE TABLE dbo.T2
    (id integer IDENTITY PRIMARY KEY, d char(2048) NOT NULL);
CREATE TABLE dbo.T3
    (id integer IDENTITY PRIMARY KEY, d char(2048) NOT NULL);
CREATE TABLE dbo.T4
    (id integer IDENTITY PRIMARY KEY, d char(2048) NOT NULL);
CREATE TABLE dbo.T5
    (id integer IDENTITY PRIMARY KEY, d char(2048) NOT NULL);
CREATE TABLE dbo.T6
    (id integer IDENTITY PRIMARY KEY, d char(2048) NOT NULL);
Each table will have 10,000 rows, consisting of a sequential reference number and a second column containing a 2048 single-byte-character string:
INSERT dbo.T1 WITH (TABLOCKX) (d)
SELECT REPLICATE('A', 2048)
FROM dbo.Numbers AS n WHERE n BETWEEN 1 AND 10000;
GO
INSERT dbo.T2 WITH (TABLOCKX) (d)
SELECT REPLICATE('B', 2048)
FROM dbo.Numbers AS n WHERE n BETWEEN 1 AND 10000;
GO
INSERT dbo.T3 WITH (TABLOCKX) (d)
SELECT REPLICATE('C', 2048)
FROM dbo.Numbers AS n WHERE n BETWEEN 1 AND 10000;
GO
INSERT dbo.T4 WITH (TABLOCKX) (d)
SELECT REPLICATE('D', 2048)
FROM dbo.Numbers AS n WHERE n BETWEEN 1 AND 10000;
GO
INSERT dbo.T5 WITH (TABLOCKX) (d)
SELECT REPLICATE('E', 2048)
FROM dbo.Numbers AS n WHERE n BETWEEN 1 AND 10000;
GO
INSERT dbo.T6 WITH (TABLOCKX) (d)
SELECT REPLICATE('F', 2048)
FROM dbo.Numbers AS n WHERE n BETWEEN 1 AND 10000;
The next step is to ensure that each lookup table is optimally organized for read-ahead:
ALTER INDEX ALL ON dbo.T1 REBUILD WITH (MAXDOP = 1, FILLFACTOR = 100);
ALTER INDEX ALL ON dbo.T2 REBUILD WITH (MAXDOP = 1, FILLFACTOR = 100);
ALTER INDEX ALL ON dbo.T3 REBUILD WITH (MAXDOP = 1, FILLFACTOR = 100);
ALTER INDEX ALL ON dbo.T4 REBUILD WITH (MAXDOP = 1, FILLFACTOR = 100);
ALTER INDEX ALL ON dbo.T5 REBUILD WITH (MAXDOP = 1, FILLFACTOR = 100);
ALTER INDEX ALL ON dbo.T6 REBUILD WITH (MAXDOP = 1, FILLFACTOR = 100);
Test Query
The original query translates into a simplified test rig as:
DECLARE @d nvarchar(max) = NCHAR(10000);

SELECT n.n,
    DATALENGTH
    (
        CONCAT
        (
            (SELECT CONCAT(T.d, T.d, T.d, T.d, T.d, T.d, @d) FROM dbo.T1 AS T WHERE T.id = n.n),
            (SELECT CONCAT(T.d, T.d, T.d, T.d, T.d, T.d, @d) FROM dbo.T2 AS T WHERE T.id = n.n),
            (SELECT CONCAT(T.d, T.d, T.d, T.d, T.d, T.d, @d) FROM dbo.T3 AS T WHERE T.id = n.n),
            (SELECT CONCAT(T.d, T.d, T.d, T.d, T.d, T.d, @d) FROM dbo.T4 AS T WHERE T.id = n.n),
            (SELECT CONCAT(T.d, T.d, T.d, T.d, T.d, T.d, @d) FROM dbo.T5 AS T WHERE T.id = n.n),
            (SELECT CONCAT(T.d, T.d, T.d, T.d, T.d, T.d, @d) FROM dbo.T6 AS T WHERE T.id = n.n)
        )
    )
FROM dbo.Numbers AS n
WHERE
    n.n BETWEEN 1 AND 10000
ORDER BY
    n.n
OPTION
(
    LOOP JOIN,
    FORCE ORDER,
    MAXDOP 1
);
The idea is to concatenate the 2048-character column to itself five times, including a Unicode character (as used in the original query as a delimiter that could not appear in the source data). Each lookup performs the same basic operation against its target table, and the final output is the result of concatenating all the intermediate results. The query hints are necessary to get the right plan shape, just because the test rig tables are so much smaller than the real ones.
The Unicode delimiter means the 2048-character single-byte data is implicitly converted to Unicode, doubling in size. It is not a crucial feature of the test, but it did appear in the original query and explains the type conversion warnings in the execution plan mentioned earlier.
The execution plan for the test query is:

I should also stress that the CONCAT operator (available from SQL Server 2012) is not crucial either. If you are using an earlier version of SQL Server, an equivalent query (for the present purposes) is shown below. I’m going to stick with CONCAT for the remainder of the post, however.
DECLARE @d nvarchar(max) = NCHAR(10000);

SELECT n.n,
    DATALENGTH
    (
        (SELECT @d+T.d+T.d+T.d+T.d+T.d+T.d FROM dbo.T1 AS T WHERE T.id = n.n) +
        (SELECT @d+T.d+T.d+T.d+T.d+T.d+T.d FROM dbo.T2 AS T WHERE T.id = n.n) +
        (SELECT @d+T.d+T.d+T.d+T.d+T.d+T.d FROM dbo.T3 AS T WHERE T.id = n.n) +
        (SELECT @d+T.d+T.d+T.d+T.d+T.d+T.d FROM dbo.T4 AS T WHERE T.id = n.n) +
        (SELECT @d+T.d+T.d+T.d+T.d+T.d+T.d FROM dbo.T5 AS T WHERE T.id = n.n) +
        (SELECT @d+T.d+T.d+T.d+T.d+T.d+T.d FROM dbo.T6 AS T WHERE T.id = n.n)
    )
FROM dbo.Numbers AS n
WHERE
    n.n BETWEEN 1 AND 10000
ORDER BY
    n.n
OPTION
(
    LOOP JOIN,
    FORCE ORDER,
    MAXDOP 1
);
Warm cache results
With all data in memory, the test query (in either form) completes in about 1.6 seconds on my laptop. Each output row contains 147,468 bytes of Unicode character data. A typical set of I/O statistics follows:

Nothing too exciting to see there, but this is just our baseline.
Cold cache results
CHECKPOINT;
DBCC DROPCLEANBUFFERS;
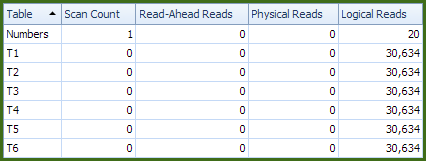
With no data in memory, the test query now runs for 18.6 seconds — almost 12x slower. The I/O statistics show the expected (but still mysterious!) work table and its associated reads:

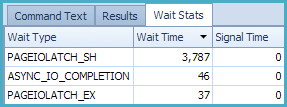
The Extended Events wait statistics provided by Plan Explorer show that SQL Server spent very little time waiting on my laptop’s slow spinning hard drive — just 402 ms:

Explanation
The are a number of factors in play here that we will look at in turn.
Nested Loops Prefetching
One of the reasons the optimizer prefers Hash Match and Merge Join for larger inputs is that the data access patterns tend to favour large sequential read-ahead. Both hash and merge tend to scan (range-scan in the case of a seek) their inputs, and the SQL Server storage engine automatically issues read-ahead when it detects this type of access. There is nothing in the execution plan to show that a base table will be read with read-ahead; it just happens.
A basic implementation of Nested Loops Join would not benefit from read-ahead at all on its inner side. The outer (driving) side of the loops join might well be a scan or range-scan of an index, and so still benefit from automatic read-ahead.
The inner side of a nested loops join is executed once per outer row, resulting in a rapid succession of small index seeks for different index values. These small seeks will typically not be large enough to trigger the automatic read-ahead mechanism. Indeed, in our test, each inner side seek is for precisely one value.
SQL Server improves on this by implementing a second read-ahead mechanism especially for Nested Loops Joins where the optimizer decides it is worthwhile. The idea is to buffer extra rows from the outer side of the join, and to use the row values in the buffer to drive read-ahead for the inner side. The effect is that the Nested Loops join becomes a partly blocking operator as outer-side rows are read into the buffer and read-ahead is issued based on buffered index key values.
This read-ahead may be either order-preserving or not, and is indicated in the execution plan by the attributes With Ordered Prefetch and With Unordered Prefetch, respectively. When unordered prefetch occurs, the inner side is processed in whatever order the asynchronous reads happen to complete. With ordered prefetching, the mechanism is careful to ensure that the order of rows entering the join is preserved on the output.
In the test rig, the ORDER BY clause means there is a need to preserve row order, so Ordered Prefetch is used:

The issue described in this post is not specific to ordered prefetching. The same behaviour is just as likely with unordered prefetching. The point is that Nested Loops prefetching is one of the requirements.
Documented trace flags 652 and 8744 may be used (with care, and after serious testing) to disable automatic read-ahead and Nested Loops prefetching respectively.
This is sometimes beneficial where all data is expected to be in memory (in which case read-ahead processing consumes resources better used by query execution) or where the I/O subsystem is extremely fast. In case you were wondering, there is no background thread for prefetching — all the work of checking whether the data is in memory, and issuing I/O if not, is performed by the worker thread executing the query.
I should stress that read-ahead and Nested Loops prefetching is generally A Very Good Thing with typical storage solutions (e.g. SANs) and both work best when indexes have low logical fragmentation.
Manufactured LOBs
The issue described here also requires that a large object (LOB) data type is manufactured before prefetching. The Compute Scalar operators in the test execution plan perform that function:

By ‘manufactured’, I mean that the source columns are not LOB types, but the expression output is. Notice the implicit conversion to nvarchar(max). To be clear about it, the issue we are analysing here does not occur when Nested Loops prefetching occurs with an expression that was a LOB type to begin with.
The Outer Join
The optimizer is quite good, generally speaking, at moving scalar expressions around. If the query had featured inner joins (whether by query design or through optimizer activities) the chances are quite good that the problematic expressions (the LOB manufacturers) would have moved beyond the prefetching, and so out of harm’s way.
It is quite tricky to preserve NULL-extension and other outer-join semantics properly when moving expressions above an outer join, so the optimizer generally does not even try. In essence, the outer join represents an optimization barrier to the LOB-manufacturing expressions.
Memory Allocation
When Nested Loops prefetching occurs with a manufactured LOB, the question arises of where to store the created LOBs when buffering rows for prefetch.
If the source data were already a LOB type, there would already be memory structures in place to handle them. When prefetching encounters a manufactured LOB, it needs to store it somewhere, since the engine is no longer processing a stream of one row at a time. It turns out that there is a small memory buffer set aside for this eventuality, which testing shows to be 24KB.
However, this 24KB (directly allocated, not via workspace memory grant) is shared across all concurrently executing prefetching joins in the query. With six such joins in the test rig plan and large manufactured LOBs, the buffer stands no chance.
As a result, query execution engages a bail-out option: A work table created in tempdb. Though the pages of the worktable may in fact remain memory-resident, overheads (including latching and using general-purpose code interfaces for access to the buffered rows) mean this is very much slower than using the direct-memory cache.
As with most internal work tables, the logical reads reported on this work table roughly indicate the number of rows processed (not 8KB pages, as for regular I/O statistics). This fact, together with the large number of items processed via the worktable in our test, accounts for the millions of logical reads reported.
The creation and use of the work table depends on run time conditions and timing. If execution finds the data it needs is already in memory, the prefetch checks are still performed, but no asynchronous read requests end up being posted. The 24KB buffer is never filled, so the need to create a work table never arises.
The more prefetch that actually occurs, the higher the chances that the buffer will fill. It is quite possible to experience a low level of prefetch with manufactured LOBs without the engine needing to bail out to a work table, especially if the LOBs are not very big and the I/O system is quite fast.
Workaround
We can rewrite the query to avoid feeding manufactured LOB data to the prefetch buffer. The idea is to use OUTER APPLY to return the data that contributes to the concatenation, rather than the result of the concatenation.
We can then perform the CONCAT operation (which handles nulls nicely without extra work) after the join, avoiding the prefetch buffer issue completely. In SQL Server versions prior to 2012, we would need to use direct string concatenation, and handle rows that are null-extended explicitly using ISNULL or COALESCE.
DECLARE @d nvarchar(max) = NCHAR(10000);

SELECT
    n.n,
    DATALENGTH
    (
        CONCAT
        (
            CONCAT(OA1.i0, OA1.i1, OA1.i2, OA1.i3, OA1.i4, OA1.i5, OA1.i6),
            CONCAT(OA2.i0, OA2.i1, OA2.i2, OA2.i3, OA2.i4, OA2.i5, OA2.i6),
            CONCAT(OA3.i0, OA3.i1, OA3.i2, OA3.i3, OA3.i4, OA3.i5, OA3.i6),
            CONCAT(OA4.i0, OA4.i1, OA4.i2, OA4.i3, OA4.i4, OA4.i5, OA4.i6),
            CONCAT(OA5.i0, OA5.i1, OA5.i2, OA5.i3, OA5.i4, OA5.i5, OA5.i6),
            CONCAT(OA6.i0, OA6.i1, OA6.i2, OA6.i3, OA6.i4, OA6.i5, OA6.i6)
        )
    )
FROM dbo.Numbers AS n
OUTER APPLY (SELECT i0 = @d, i1 = T.d, i2 = T.d, i3 = T.d, i4 = T.d, i5 = T.d, i6 = T.d FROM dbo.T1 AS T WHERE T.id = n.n) AS OA1
OUTER APPLY (SELECT i0 = @d, i1 = T.d, i2 = T.d, i3 = T.d, i4 = T.d, i5 = T.d, i6 = T.d FROM dbo.T2 AS T WHERE T.id = n.n) AS OA2
OUTER APPLY (SELECT i0 = @d, i1 = T.d, i2 = T.d, i3 = T.d, i4 = T.d, i5 = T.d, i6 = T.d FROM dbo.T3 AS T WHERE T.id = n.n) AS OA3
OUTER APPLY (SELECT i0 = @d, i1 = T.d, i2 = T.d, i3 = T.d, i4 = T.d, i5 = T.d, i6 = T.d FROM dbo.T4 AS T WHERE T.id = n.n) AS OA4
OUTER APPLY (SELECT i0 = @d, i1 = T.d, i2 = T.d, i3 = T.d, i4 = T.d, i5 = T.d, i6 = T.d FROM dbo.T5 AS T WHERE T.id = n.n) AS OA5
OUTER APPLY (SELECT i0 = @d, i1 = T.d, i2 = T.d, i3 = T.d, i4 = T.d, i5 = T.d, i6 = T.d FROM dbo.T6 AS T WHERE T.id = n.n) AS OA6
WHERE
    n.n BETWEEN 1 AND 10000
ORDER BY
    n.n
OPTION
(
    LOOP JOIN,
    FORCE ORDER,
    MAXDOP 1
);
The execution plan for the rewritten query looks visually similar to the problematic one:

However, the Compute Scalars no longer manufacture a LOB data type, they just emit column and variable references:

All the concatenation work (and LOB manufacture) is performed by the final top-level Compute Scalar in a single monster expression [Expr1056]:

Warm cache results
With all data in memory, the new query completes in 1.8 seconds (very slightly up on 1.6 seconds before):
Cold cache results
When all data must be fetched from disk, the query issues optimal prefetching and completes in 7.3 seconds (down from 18.6 seconds) with no work table:

The Extended Events wait statistics now show 3.8 seconds spent waiting for my laptop’s slow spinning disk (which is a good thing!)
Final Thoughts
The issue represented here still reproduces on SQL Server 2017 CU13 (tested March 2019). Cold cache results on a faster laptop with a good SSD drive were 25 seconds before the rewrite, and 2 seconds after.
Worktables can appear in STATISTICS IO output for a wide range of reasons, but if you encounter one with a very large number of reads — particularly LOB reads — you may be encountering this issue. The workaround rewrite may not always be possible, but you should be able to refactor your query to avoid the issue now you know it exists.
I am not a fan of doing large amounts of string manipulation in SQL Server. I am always particularly suspicious of the perceived need to split or concatenate large volumes of strings. I am, however, a fan of always using explicit data types (rather than relying on implicit conversions) and generating relatively small query plans that offer the query optimizer clear and obvious choices.
By necessity, this often means writing small SQL queries in separate logical steps (and no, long chains of common table expressions do not count!)
© Paul White
email: SQLkiwi@gmail.com
twitter: @SQL_Kiwi
thanks for this!
ReplyDelete